How I Beat A Supercomputer
Written on May 23rd , 2021 by Gerard Kirwin
Photo by Reuters via Khaleej Times
A while back on Instagram, I saw a post that a supercomputer used data from the last 10 years to predict the final English Premier League football table (or soccer standings for American readers). The supercomputer based its predictions on Christmas Day, a symbolic midway point for the season. This piqued my interest because of my interest in data science and soccer but also because I wondered whether a supercomputer would be necessary to predict it.
When I was in school for meteorology, the weather forecasts and climate models that we learned about relied on supercomputers. The atmosphere is vast, the earth is large and there’s a lot of data points such as temperature, wind speed and atmospheric energy to account for. Soccer games produce a lot of data as well but nowhere near on the scale.
Even if you did simulate the remaining games a large amount of times using a Monte Carlo simulator like FiveThirtyEight, all you would need is a consumer-grade PC. A supercomputer seems unnecessary for this task and I suspect the use of “supercomputer” in the headline was a combination of clickbait and taking advantage of tech illiteracy in the public.
Sarah Winterburn from Football365 claims that the “supercomputer” is just running off averages. For example, Arsenal were 15th on Christmas Day and their predicted finish of 16th is an average finish of any team in 15th place on Christmas Day. I suspect this isn’t far off from the truth. I looked on The Sun and Bettingexpert.com and there was no methodology for this anywhere.
On a whim one afternoon, I decided to type a little machine learning code to see what I would get as a result. I then decided to turn this into a portfolio project and see if my predictions could beat the “supercomputer”.
Data
The data I needed to run was the table at Christmas and the final table. However, teams may have played in different amounts of games by Christmas Day. Teams may have completed less games on the same day due to fixture congestion, the placement of Christmas Day in the footballing week and in the case of the last year, the effects of COVID-19. I decided instead of basing it exactly on the Christmas table, that I would pick a set number of matches so the number of goals and points from extra or missing games wouldn’t skew the results. I used 17 games as my baseline because that was the most common number of games completed by Christmas Day.
I then set about gathering the data and merging the Christmas Day and Final tables so I had a single data table to train and test. I also gathered the 17 game results from the 2020-2021 season for my final test.
Modeling
My next step was to see what algorithms would give me the best results from the Christmas Day table. I borrowed a method from this page to test out some algorithms and which worked best. The code produced the results of the most accurate models from a list. Logistic Regression and LinearDiscriminantAnalysis gave us back the best results.
Since the accuracy was based on predicting the number of points at the end of the season and not the position, the accuracy values are quite low. The points total system (3 points for a win and 1 for a draw or tie) is a calculation, not a value so I wasn’t expecting these algorithms to predict the exact numbers. Remember we are looking to predict the order of the finish, not the points total.
I decided to use all the relevant columns in the Christmas Day table, Wins, Losses, Draws, Goals Fielded, Goals Allowed, Goal Difference and Points. My rationale was that they were all good indicators of points and position, but picking and choosing some would skew the results in one way or another. For example, Team A could win fewer games than Team B but could finish ahead if they had more draws and therefore more points. So for simplicity, I left all these features in.
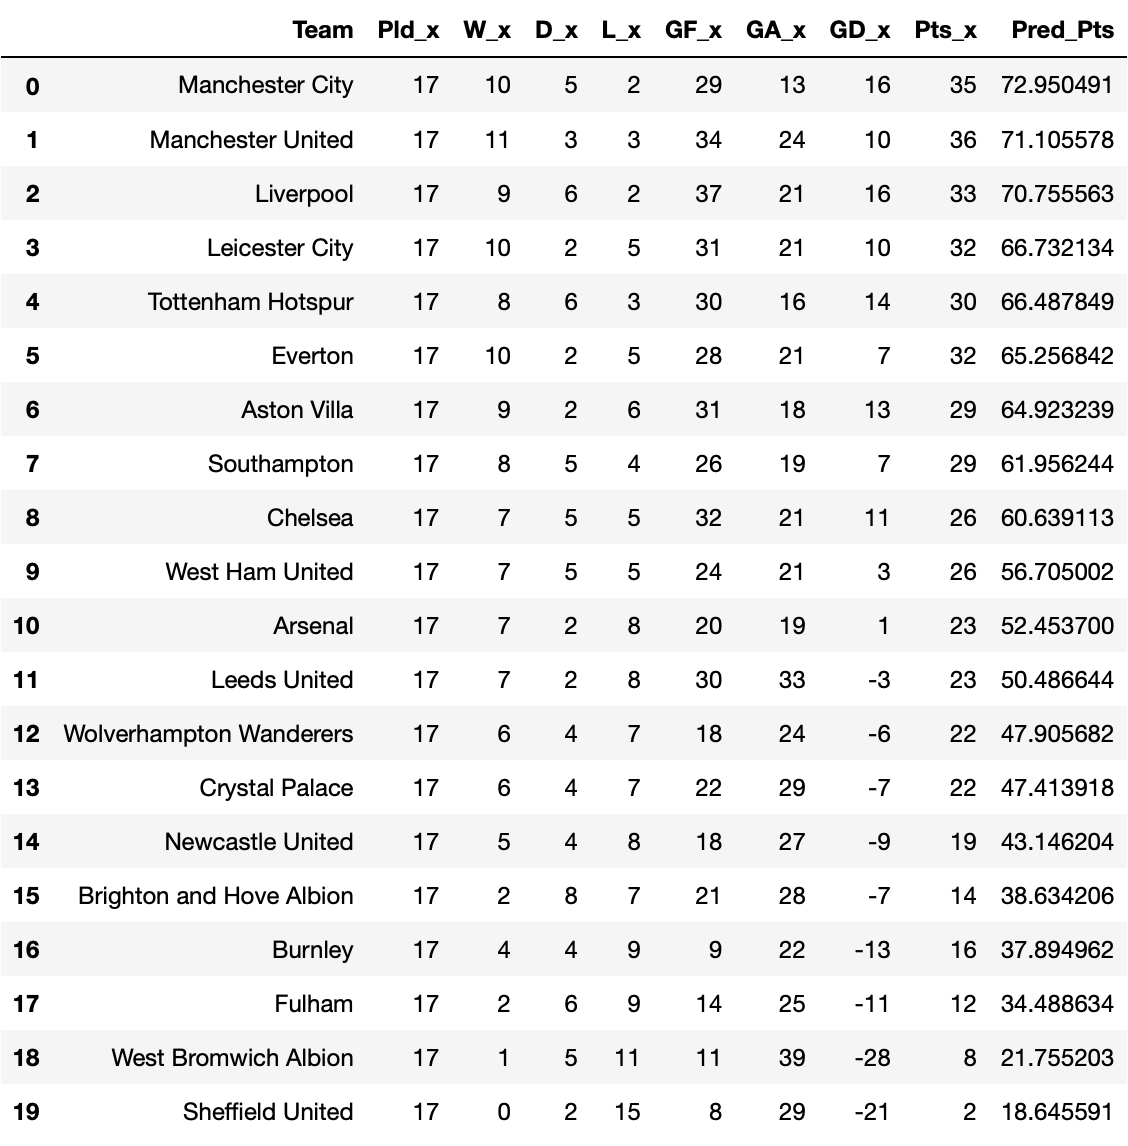
After testing out Logistic Regression on my test and train data, I was ready to let it loose on the current year’s data. Here were my results:

Once again, the points values are secondary to the order.
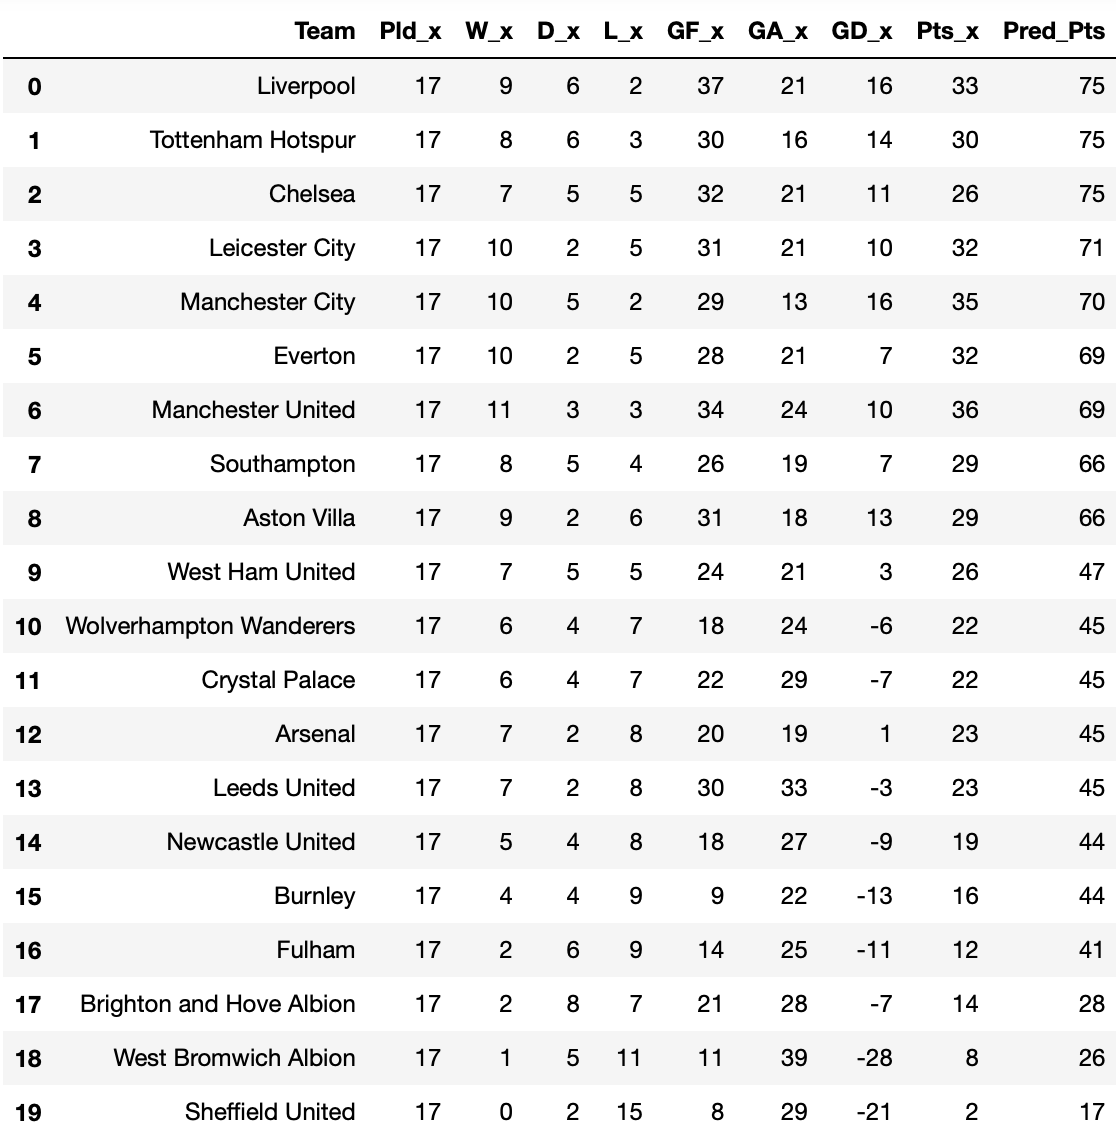
I did the same thing for LinearDiscriminantAnalysis, which had the same accuracy score as the Logistic Regression. However, their results were very different:

Analysis
I ran the other models to see what I would get and you can see those in my Jupyter notebook on my GitHub page.

With the 2020-2021 season over, the Premier League’s champion was Manchester City who was predicted by my simple algorithm but not by a “supercomputer”. Overall, my algorithm was able to predict 10 out of the 20 teams correctly, while the “supercomputer” correctly predicted just 4. The top 3 and bottom 5 places were perfectly predicted by the algorithm, while the “supercomputer” only captured the bottom 3, also known as the relegation places.
My algorithm didn’t predict the middle of the table as well. There are some easy explanations for this. Firstly, these teams were closer to each other in total points. There is a 17 point gap between 1st and 3rd but 7 points between 6th and 11th. An extra win could have elevated 10th place to 7th.
An algorithm also doesn’t account for teams improving or getting worse. Everton, Aston Villa and Southampton had dramatic drops in form. The “supercomputer” had the three teams finishing 4th, 9th and 7th respectively. My algorithm had them finishing 6th, 7th and 8th. The three teams finished 10th, 11th and 15th.
On the reverse, West Ham, Arsenal and Leeds have had improvements in form. The “supercomputer” had them finishing 10th, 15th and 14th respectively. My algorithm had them finishing 10th, 11th and 12th. These three teams finished 6th, 8th and 9th.
Next Steps
This was my first machine learning project and I’m pretty happy with the results. I must admit I was watching the final games, hoping some teams would fall into place that would make my results look better. But I’m not that surprised that my algorithm did so well, especially compared to the possibly phony “supercomputer”. Teams can have changes in form over a year but overall, indicators such as goals scored and games won are good indicators of a team’s performance and future performance within a season.
What I would do next is try to refine the algorithm and research ways to more accurately depict the number of points. I could also include more data to train the algorithm on. I only used data from the last 10 years to match what the “supercomputer” did but the Premier League itself has nearly 30 years of results and English football itself has over 100 years.
For my next project, I would like to look more into machine learning and artificial intelligence. I think it would be a fun project to build and refine something that produces an image or sound based on input.
